Hi,
I'm new to retool. Here is my question.
I'm trying to build a dashboard for our internal team that reports metrics based on the jobs that are processed through our platform. We would like this data to be represented data for each month. We are using google sheets for maintaining records of the jobs that are processed. Here is a sample representation of this data:
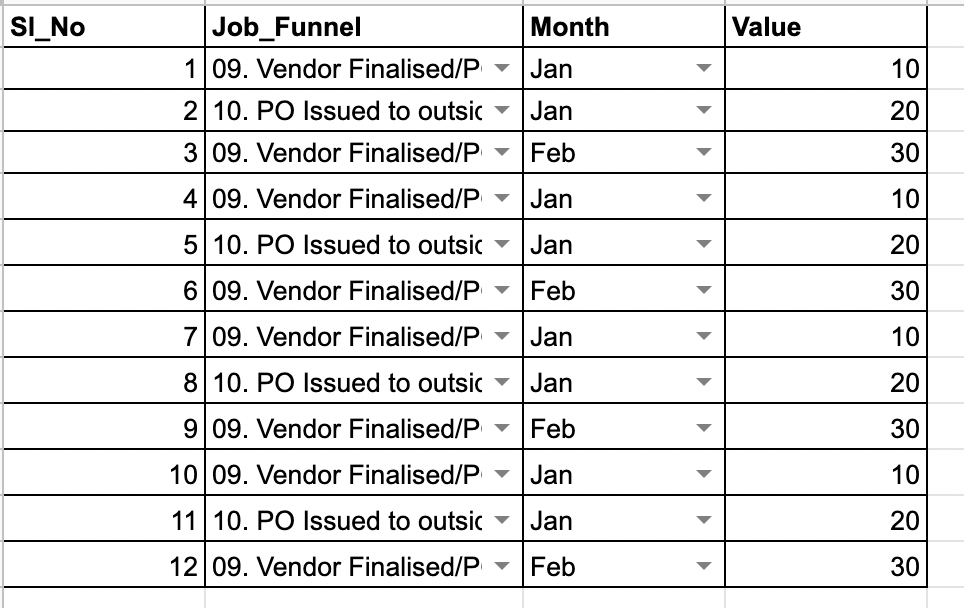
Every job has a unique serial number. Job_Funnel column specifies in which bucket this job currently lies.(This is a dropdown in our gsheet and has 11 different values that it can take)The value column specifies the value of this job.
Here is a representation that we would like to have.
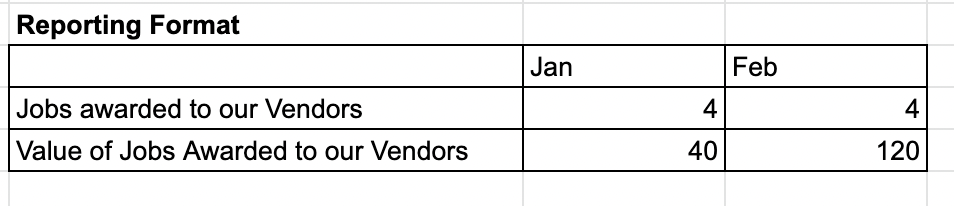
I've shown two rows here which are basically the metrics we would like to compute and this should be done for each month. For one of the metrics shown above - Jobs awarded to our vendors, here is how its computed for the month of Jan. We first find all the jobs that have ' 'Month' column = Jan and then filter out those who have 'Job_Funnel' column value = "09. Vendor Finalised/PO Issued". The count of this data would give us the the metric for Jan. Similarly for the second metric, we sum the 'Value' column of all the jobs that have Month ="Jan" and Job_Funnel ="09. Vendor Finalised/PO Issued".
We have a number of such metrics that are based on the "Job_Funnel" column of a particular job and we need to perform these calculations for each month.
How do we do this in retool?
I have connected my gsheet to retool app. But don't know how to perform these computations and transform the data to bring it into a view that I had shown in the previous image.
Any help would be highly appreciated.