Good question! This is something we should really improve. Right now the strategy is to just drag on a 4x4 of TextInputs. @alex — do you want to add this to our spreadsheet as well? Thanks!
1 Like
In the meantime, I think I can hack something together by building an object of arrays and iterating over them in listview with the index. I can build the conditional formatting in by concatenating the html to be in the value.
@blue-coat-atc thanks for the feedback here! Adding some kind of pivot solution is on our upcoming roadmap. There is also an undocumented feature of AlaSQL (the library we use to power the Query JSON with SQL resource) that allows you to pivot, but it’s a bit touchy right now.
Tables are such an important component of any data-based tool, that I suspect it’s the core of every Retool app, as well. At the risk of recreating too much of what Excel does, I would certainly welcome the introduction of a more powerful table component. There are a few in the React ecosystem, that are quite powerful and could be extended if necessary.
2 Likes
Apologies for the bump, but I was about to ask something similar when I found this. Is the 4X4 of textinputs still the best strategy?
If so, I’ll add my +1 for this - retool is great for workflow, and I’d love to use it for reporting too. This is easily the biggest missing feature stopping me from doing so.
2 Likes
Hi. Just searching on the forum for Pivot solutions and found this so I’ll add my two cents worth (and apologies 'cause I’m a javascript and contemporary web app noob, I was a dev many years ago but of of practice): As mentioned there are a bunch in the ecosystem, like orb.js (although not sure if this is being maintained ).
Is there a way to incorporate this in retool? Could you include it as a library from https://cdnjs.com/libraries/orb, and then include similar HTML, including the javascript in the HTML? Akin to the examples on here?
Don’t really understand how to do this, or critically how the javascript would reference / ‘find’ a retool query.
Anyone with any bright ideas, please shout: Otherwise I’m going to have to create a standalone web app, which uses the same underlylng postgres db, and then put it in an iframe in retool 
At the moment I am literally using MS-Excel, connecting via ODBC to the db but maintaining all the data via retool, as very few solutions are as good as Excel itself, unless maybe you go to PowerBI / Tableau / DataStudio.
Thanks!
bump? any ideas anyone?
Hi there @domjammoo!
My apologies in advance here, but I’m a little lost on your end goal 😅 Are you just looking to include a JS library in Retool? If so, we have a section in our docs on that! https://docs.retool.com/docs/custom-js-code#custom-javascript-libraries--npm-modules
Hey Victoria,
So my js skills are pretty basic and I've had a go at incorporating a library but is a bit beyond my capability level. My use case is : I want a pivot table. If anyone has found any way to do this (including, but not limited to, integrating an external JS library) then it would be really useful to see a worked example. Not hugely optimistic that anyone else will have done this / have the same needs that I have
1 Like
The lack of pivot tables is really a miss. I did come up with a solution that does some javascript transformation of a data set (happy to share if anyone is interested) but pivot tables seem to be basic functionality that should be available in a data tool - especially since that is nothing that can be easily implemented via (standard) SQL
2 Likes
It's not pretty, but it works ![]()
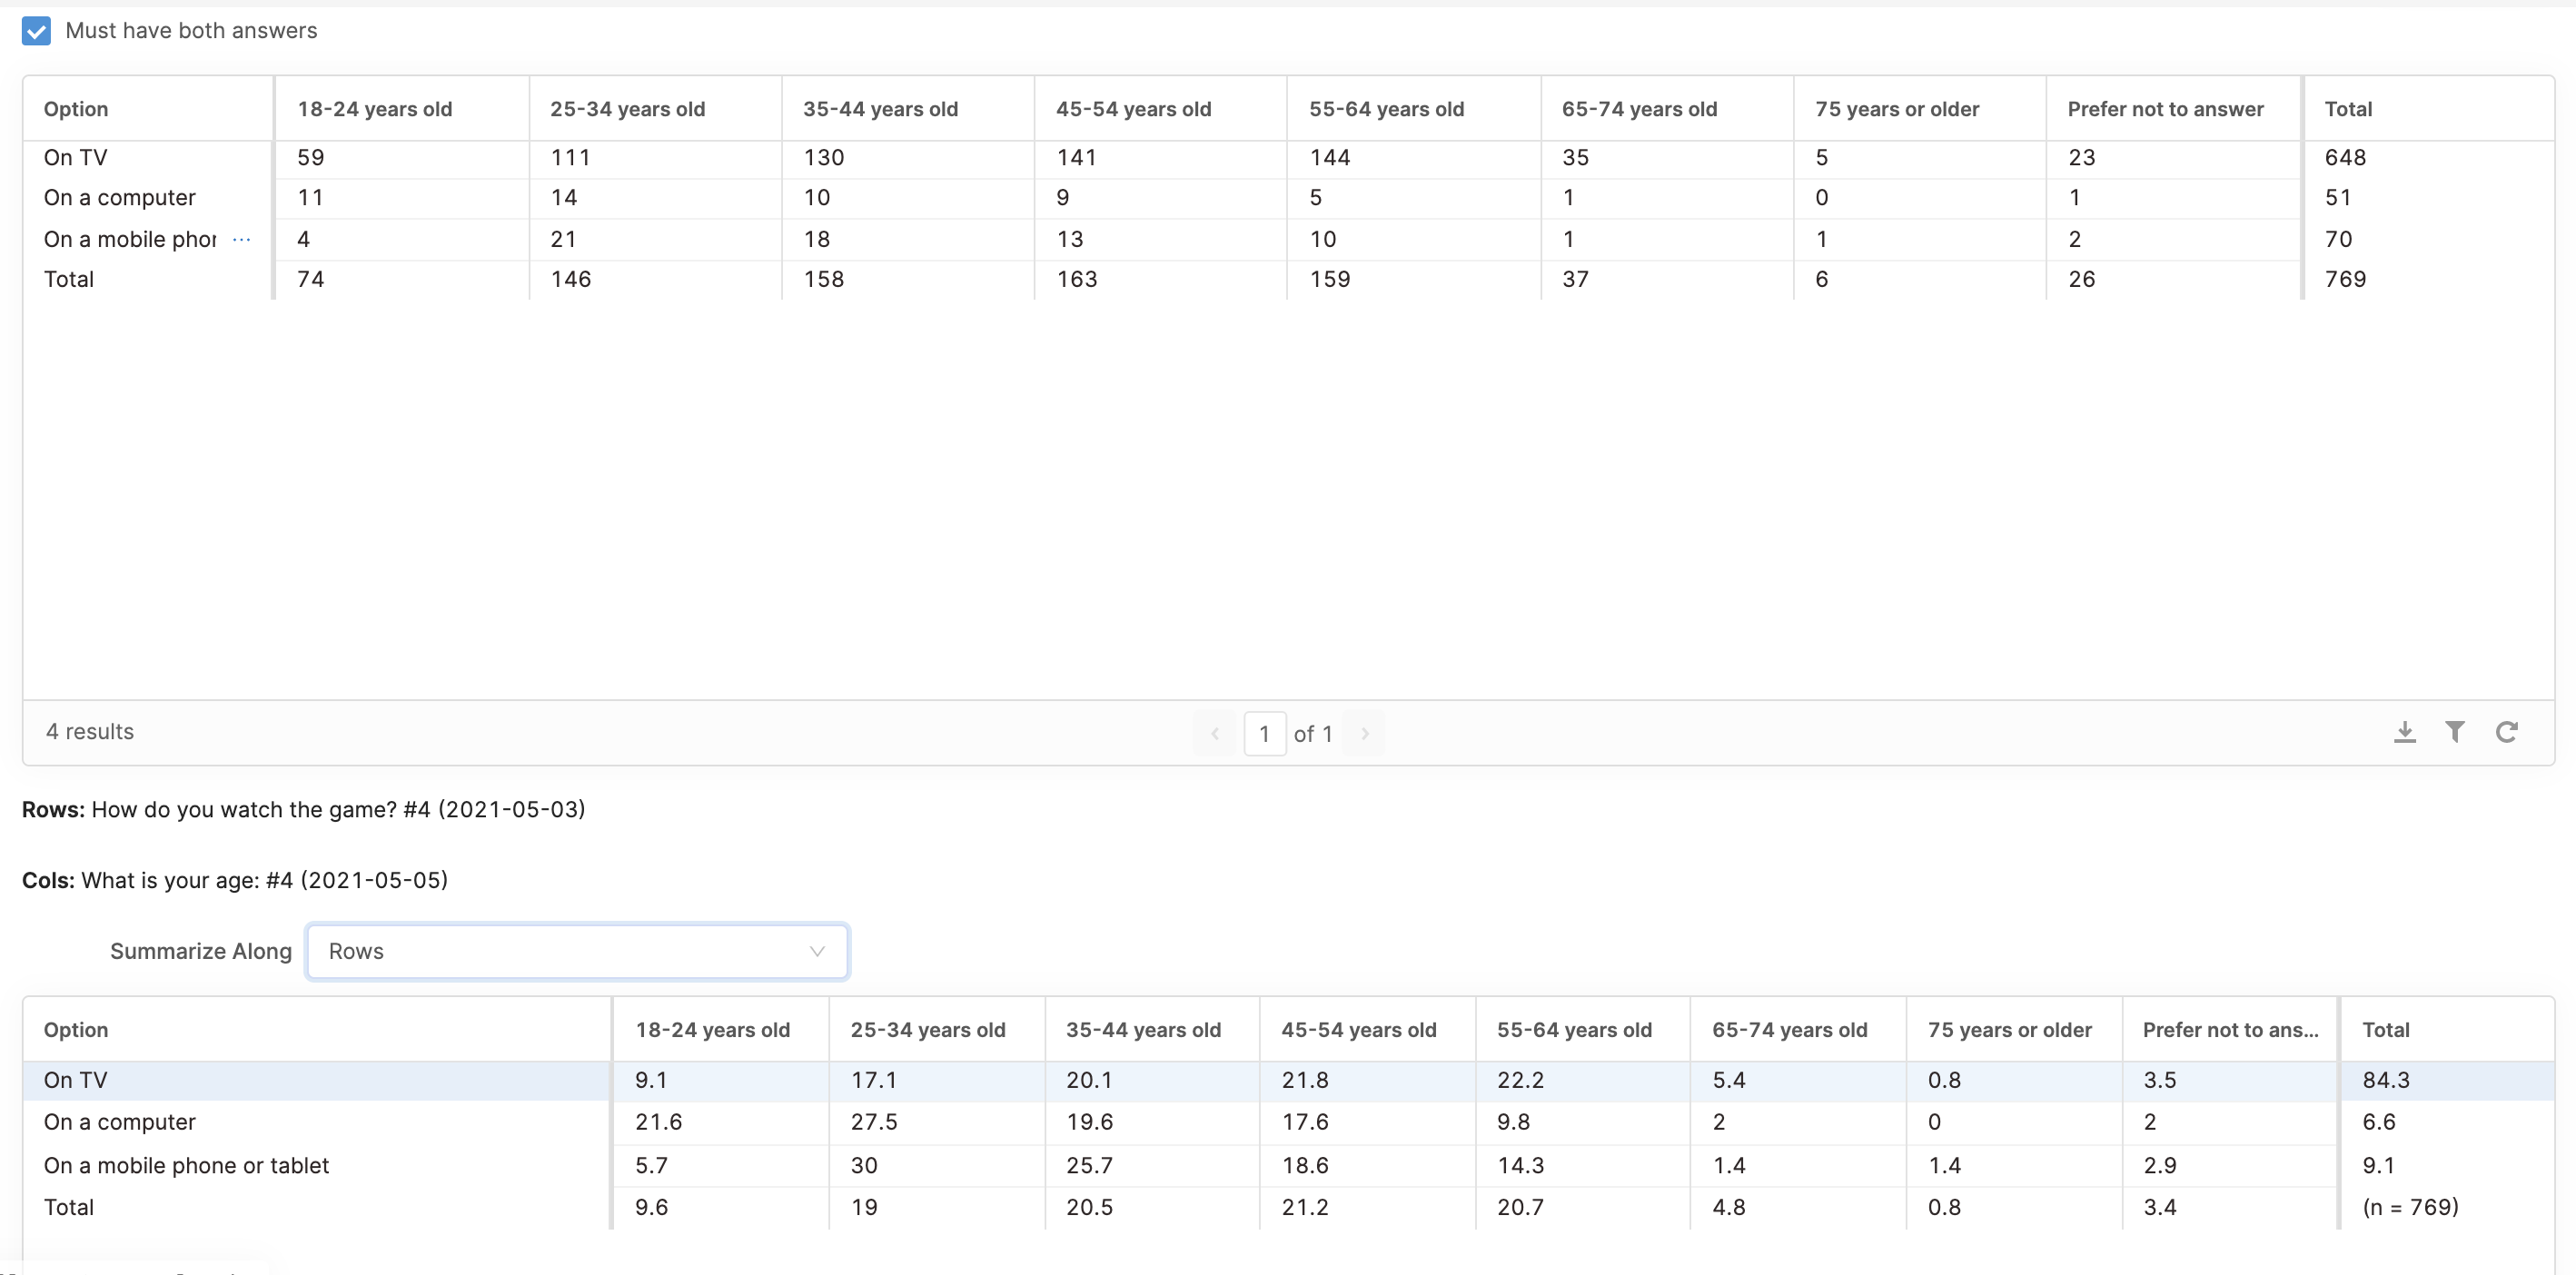
My challenge is that I want to show results from two different survey questions (out of a pool of hundreds) and cross tab them. So answers to question 1 will be shown as rows answers to question 2 as columns (see screenshot below).
My data set (XTab) is pretty simple:
Answer Question 1 | Answer Question 2 | user ID
So I am trying to get:
- number of people who chose option A for Answer 1, option W for Answer 2
- number of people who chose option B for Answer 1, option W for Answer 2
- etc.
And am looking for two outputs: absolute numbers and percentages (see the two different tables in the screenshot below)
I am replacing null from the database with 'N/A' - that happens if someone answered Question 1, but not Question 2 (so this would be: # of people who chose option B for Answer 1, option N/A for Answer 2)
I provide two options for the end user:
- only consider records of people that provided answers to both questions
- along which dimension do I want to summarize (Row (row), Column (col) or table (table)) for the percentages?
Lastly I did get mixed up with the row and column notation, so rowLbl and colLbl might be flipped. However; it works (and sorry if it's a bit of a mess - needed to get it done ... ![]() )
)
let rows = {};
let rowLbl = [...new Set( XTab.data.PO_TEXT1)];
let colLbl = [...new Set( XTab.data.PO_TEXT2)];
const innerJoin = CBBoth.value;
if (innerJoin){
  rowLbl=rowLbl.filter(x=> x !='N/A');
  colLbl=colLbl.filter(x=> x !='N/A');
}
let totalTable=0;
let totalRows={};
let totalCols={};
//po_text1 ==> row labels
//po_text2 ==> col labels
for (let i=0; i<XTab.data.USER_ID.length; i++){
  if( (XTab.data.PO_TEXT1[i] != 'N/A') || !innerJoin){
    if (!rows[XTab.data.PO_TEXT1[i]]) {
      // create new row for po_text1
      rows[XTab.data.PO_TEXT1[i]] = {};
    }
    if (!rows[XTab.data.PO_TEXT1[i]][XTab.data.PO_TEXT2[i]]) {
      // create new row for po_text1
      rows[XTab.data.PO_TEXT1[i]][XTab.data.PO_TEXT2[i]] = 0;
    }
    if ((XTab.data.PO_TEXT2[i] != 'N/A') || !innerJoin){
      rows[XTab.data.PO_TEXT1[i]][XTab.data.PO_TEXT2[i]]++;
	    totalTable++;
      totalRows[XTab.data.PO_TEXT1[i]]= ++totalRows[XTab.data.PO_TEXT1[i]]||1;
      totalCols[XTab.data.PO_TEXT2[i]]= ++totalCols[XTab.data.PO_TEXT2[i]]||1;
    }
  }
}
let absolute = {};
let perc = {};
let total;
absolute['Option'] = [...colLbl,'Total'];
perc['Option'] = [...colLbl,'Total'];
for (let r=0; r<rowLbl.length; r++){
  absolute[rowLbl[r]]=[];
  perc[rowLbl[r]]=[];
  for (let c=0; c< colLbl.length; c++){
      switch(DDSumType.value) {
        case 'table':
          total = totalTable;
          // code block
          break;
        case 'col' :
          total = totalRows[rowLbl[r]];
          break;
        case 'row' :
          total = totalCols[colLbl[c]];
          break;
        }
    absolute[rowLbl[r]].push(rows[rowLbl[r]][colLbl[c]]||0);
    perc[rowLbl[r]].push(Math.round(1000*(rows[rowLbl[r]][colLbl[c]]||0)/total)/10);

    let ns = [];
    absolute['Option'].forEach(x => ns.push(totalCols[x]))
    absolute['Total'] = ns;
    perc['Total'] = ns.map(x => Math.round(1000*x/Object.values(totalRows).reduce((a, b) => a+b))/10);

  }
  absolute[rowLbl[r]].push(totalRows[rowLbl[r]]);
  perc[rowLbl[r]].push(Math.round(1000*totalRows[rowLbl[r]]/Object.values(totalRows).reduce((a, b) => a+b))/10);
}
absolute['Total'][absolute['Total'].length-1] = Object.values(totalRows).reduce((a, b) => a+b)
perc['Total'][absolute['Total'].length-1] = `(n = ${Object.values(totalRows).reduce((a, b) => a+b)})`

return {absolute, perc, totalCols, totalRows, rowLbl}
Wow that's great. I suspect it's not possible to do it in much less code, a pivot table is a relatively complicated thing. May well give this a go. Thanks for sharing!
Hey, I might be late,
but I have my work around here.
The workaround requires pivottable.js, basically using a custom HTML components to wrap the pivot table. Hope this helps! 
<html>
  <head>
    <style>
      * {font-family: Verdana;}
      .node {
        border: solid 0.5px white;
        font: 1px sans-serif;
        line-height: 1px;
        overflow: hidden;
        position: flexible;
        text-indent: 0.5px;
      }
    </style>
  </head>

  <head>
    Pivot Table
  </head>


  <body>
    <script src="https://cdn.plot.ly/plotly-basic-latest.min.js"></script>

    <script src="https://unpkg.com/browse/d3@7.1.1/dist/d3.min.js"></script>
	<script src="https://cdn.tryretool.com/js/react.production.min.js"
        crossorigin></script>
	<script src="https://cdn.tryretool.com/js/react-dom.production.min.js"
        crossorigin></script>
  <script type="text/javascript" src="https://www.unpkg.com/browse/react@17.0.1/umd/react.production.min.js"></script>

  <script type="text/javascript" src="https://www.unpkg.com/browse/react@17.0.1/umd/react.production.min.js"></script>

	<script src="https://cdnjs.cloudflare.com/ajax/libs/jquery/3.6.0/jquery.min.js"></script>
  <script src="https://ajax.googleapis.com/ajax/libs/jqueryui/1.10.3/jquery-ui.min.js"></script>

<script src="https://cdnjs.cloudflare.com/ajax/libs/pivottable/2.23.0/pivot.min.js"></script>

    <script src="https://cdnjs.cloudflare.com/ajax/libs/d3/7.1.1/d3.min.js"></script>

<link rel="stylesheet" type = "text/css" href="https://cdnjs.cloudflare.com/ajax/libs/pivottable/2.23.0/pivot.min.css"> </link>

  <link type="text/css" rel="stylesheet" id="dark-mode-custom-link"></style>
  <link type="text/css" rel="stylesheet" id="dark-mode-general-link"></style>
  <style lang="en" type="text/css" id="dark-mode-custom-style"></style>
  <style lang="en" type="text/css" id="dark-mode-native-style"></style>
		<script type="text/javascript">

    function buttonClicked() {
            window.Retool.triggerQuery('query2')
    }
		window.Retool.subscribe(function(model){
      if(!model){
        console.log("Invalid model!"); return;
      }
      var data = model['data'];

      $(function(){

          console.log(data);
          $("#output").pivotUI(
          data,{
              rows: ["wallet","sym"],
            	cols: ["network","protocol"],
              vals: ["balanceUSD"],
              aggregatorName: "Integer Sum",
              rendererName: ["Heatmap"],

          },

          );
       });
    })

		</script>
    <script type="text/babel">
    <div id="output"></div>

		</script>

    <div id="output"></div>
  </body>
<button onclick="buttonClicked()">Trigger Query</button>
</html>
2 Likes
Hello @chunyau I have been trying to get the pivottable.js to work in retool but still not working.
The problem i am facing now is that my data appears like a list not an array. can you shed some more light on how you got it working. cheers
Hi @chunyau ,
Just trying to get this working. Am I right in thinking that you are doing this in a 'custom component', not in the new HTML component ? I've edited your code to make it specific to my data structures / query but I can't work out what to put in the 'model' section of the in order to make the data available to the HTML. Could you share your exact syntax? I tried using
{{query1.data}}
which does return an object, but that doesn't seem to work, I get, 'An error occurred rendering the PivotTable UI.'
Any help appreciated! Thanks.
Hello anyone interested in pivot tables.
I finally got this working myself with pivottable.js. Just a few tweaks (and some understanding) required in addition to the example above from chunyau (there was a rogue comma amongst other things).
My model looks like this (ignore the x_hello, am using for debugging):
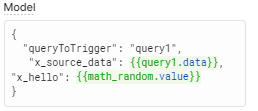
Query 1 is a select from a SQL db with a formatDataAsArray in the transformer of the query:

Then this is the iframe. The problem I was making was not putting the pivotUI function within window.Retool.Subscribe function. I am sure there are other ways to overcome that but this is simple and works.
Obviously the rows, cols, vals are specific to my query.
<!DOCTYPE html>
<!-- saved from url=(0058)http://horner.github.io/pivottable/examples/simple_ui.html -->

<html><head>  <meta http-equiv="Content-Type" content="text/html; charset=UTF-8">
        <title>Pivot Demo</title>

  <script src="https://cdnjs.cloudflare.com/ajax/libs/jquery/1.8.3/jquery.min.js" integrity="sha512-J9QfbPuFlqGD2CYVCa6zn8/7PEgZnGpM5qtFOBZgwujjDnG5w5Fjx46YzqvIh/ORstcj7luStvvIHkisQi5SKw==" crossorigin="anonymous" referrerpolicy="no-referrer"></script>

<script src="https://cdnjs.cloudflare.com/ajax/libs/jqueryui/1.9.2/jquery-ui.min.js" integrity="sha512-cViKBZswH231Ui53apFnPzem4pvG8mlCDrSyZskDE9OK2gyUd/L08e1AC0wjJodXYZ1wmXEuNimN1d3MWG7jaQ==" crossorigin="anonymous" referrerpolicy="no-referrer"></script>

<script src="https://cdnjs.cloudflare.com/ajax/libs/pivottable/2.23.0/pivot.min.js" integrity="sha512-XgJh9jgd6gAHu9PcRBBAp0Hda8Tg87zi09Q2639t0tQpFFQhGpeCgaiEFji36Ozijjx9agZxB0w53edOFGCQ0g==" crossorigin="anonymous" referrerpolicy="no-referrer"></script>

<link rel="stylesheet" href="https://cdnjs.cloudflare.com/ajax/libs/pivottable/2.23.0/pivot.min.css" integrity="sha512-BDStKWno6Ga+5cOFT9BUnl9erQFzfj+Qmr5MDnuGqTQ/QYDO1LPdonnF6V6lBO6JI13wg29/XmPsufxmCJ8TvQ==" crossorigin="anonymous" referrerpolicy="no-referrer" />

<style>
   * {font-family: Helvetica;}
</style>

</head>

<body>

  <script>
      function buttonClicked() {
        window.Retool.triggerQuery('query1')
      }
  </script>

  <script type="text/javascript">

    window.Retool.subscribe(function(model) {
        // subscribes to model updates
        // all model values can be accessed here

      var x_data = model.x_source_data

    $(function(){

      $("#output").pivotUI(
              x_data,
          {
              rows: ["viewpoint_level1","viewpoint_sequence","a_h_plot_name","viewpoint_level2_sequence","viewpoint_level2","plot_field_name","record_type"],
              cols: ["a_h_month_formatted"],
              vals: ["field_value_comparison"],
              aggregatorName: ["Sum"]
          }
          )})
    });

</script>

<button onclick="buttonClicked()">Trigger Query</button>

<div id="output" style="margin: 10px;"></div>

</body></html>
Lastly - the whole pivot was working in edit mode but simply not appearing when not in edit mode.
I created this JS query, and set it to run on page load on a 1500 ms delay:
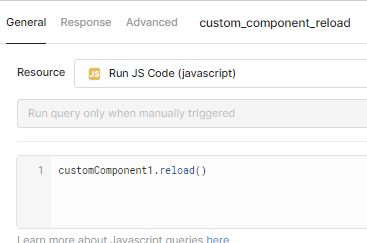

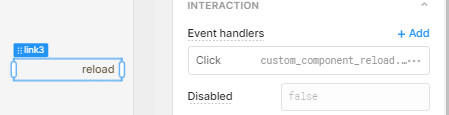
However that didn't always work, as query1 needs to have finished. So I added a little link to re-run that query. That fixed it.
Hope that all helps someone, I've been trying to get this working for ages ![]()
2 Likes
What great news @domjammoo!!! Mostly. Minus the time you had to spend on this and the trigger hacks you're having to employ. I'm working on getting that custom component walkthrough up next week, but glad you're mostly unblocked in the meantime ![]()
Hey thanks Victoria, I think just talking it through and looking at a couple of your simpler custom components helped finally jolt everything into place. Quite a lot of the necessary info is in the tutorial, but there's also a bunch that you have to work out.
Now struggling with getting Orb.js working, which is a React component. Again it's just my lack of js / react / web dev skills which is the issue. The sticking point is the actual rendering of the grid, the orb example has this:
new orb.pgridwidget(config).
         .render(document.getElementById('react'));
And I can't work out how to integrate this with this:
  const ConnectedComponent = Retool.connectReactComponent(MyCustomComponent);
  ReactDOM.render(<ConnectedComponent />, document.getElementById("react"));
This definitely doesn't work:
const MyCustomComponent = ({ triggerQuery, model, modelUpdate }) => (
    <p>{new orb.pgridwidget(config)};</p>
 );


  const ConnectedComponent = Retool.connectReactComponent(MyCustomComponent);
  ReactDOM.render(<ConnectedComponent />, document.getElementById("react"));
If there's something really obvious that I'm missing then advice greatly appreciated, otherwise I'll just keep experimenting with syntax ..... thanks again ![]()
1 Like