Thats actually a great question. I suppose if I could style it, so that the image size could just be really really small, that might be a way to work through this.
Seems to be an image grid takes a one dimensional array only right?
is there a way to have it work for 2d?
So i flattened the 2d array and voila, I think i have something i can work with.
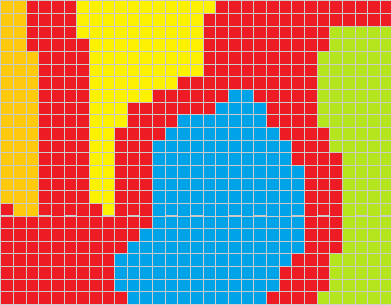
So this is a portion of the default map with nothing placed on it.
Now i need to gather data from a couple tables which have x,y coords on it, and map those coords to the 0,1,...,9999,10000 th element of this array, and present that data visually.
Progress!
This is...incredible! Is there anything right now that I can help with? ![]()
Well today I'd like to capture the index of the grid wherever i click.
So if i click on square 3196 i'll be able to see details of what occupies that square.
Ok I think I got the the square being clicked.
Now something fairly hard, at least for my knowledge.
I have a couple resources joined with json query from another solved question from here Combining Data to Get Consumer Sales
So.
Assuming i have some data, i can have something occupy a x,y location. Only one data source can occupy a square: crops.location or furniture.location on the same row of data.
I need to change the image grid to reflect the new data that i imprint onto the default map.
Need guidance on that.
“I need to change the image grid to reflect the new data that I imprint onto the default map”
Hmm! I think I can be more helpful if I can understand your current workflow a bit better ![]() How are you imprinting this new data? Where is the new data coming from? Are you changing the underlying query?
How are you imprinting this new data? Where is the new data coming from? Are you changing the underlying query?
Ok so the default map is a big 2d array 100x100.
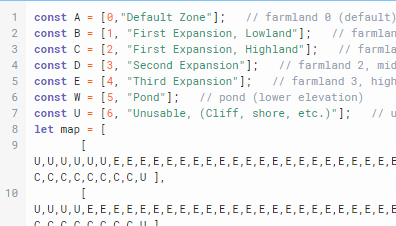
I create all those squares based on the values of that array.
Next I send two queries. One to a Crops database. And the next to a Home database. Both can hold items that will also be put onto this map.
I want to populate this default map with the new data that those 2 new queries have.
So a seed of corn could occupy square 7689, a house could occupy square 8080. I want to see that on the map.
So the final product, should be that big map of squares, with other colours/icons peppered around. If I click on that square i should be able to get the right information to modify it in a separate component.
Cool! And how are the 2 new queries set up so we know which data point goes in which square? Or is that the part you’re currently stuck on?
Sort of how i am stuck
They are both basic select queries with "location" variable for homestead and "tilenum" for the crops tables. effectively they hold the same data, x and y, they were just named differently as we develop the game for some reason.
Besides the unusable squares "U" and "W"ater in the array, a square can hold either furniture or a crop.
Would it be possible to step into your app to take a look around? If so, would you mind DM’ing me a link to your app? If not, happy to work with what you’ve already shared ![]()
our app is locally hosted so I don't know of a way to link to you.
I don't really know what "step into your app" means if that is some lingo i missed out on.
Ah, my apologies! We can log into Cloud orgs once we have permission, but in your case (On Premise), an app export would work as well. App exports don't include query data, so exporting your app with a HAR file would be particularly helpful. If you're not interested, then no worries at all.
Your current app seems a bit more complex than our usual apps that we debug over text, so perhaps coming to an Office Hours session sometime in the coming weeks could be enlightening!
Or if you have any specific questions/error messages, happy to continue trying to troubleshoot here ![]()
The HAR file is huge and seems like it could include a bit of sensitive data. So i am very interested in figuring this out, but want to do so in a way that doesnt expose too much.
I did sign up for office hours this coming tuesday.
Hey there @dlbhilbig! Thanks for attending Office Hours on Tuesday ![]()
This question has come up before and seems like it might be a good chance to explore how to use React custom components in Retool! This isn't meant to be a complete example but hopefully, it can give some idea of what can be done. A JSON export is included at the bottom to play around with!
We can use the boilerplate that's provided when creating a new custom component. That has a lot of what's needed to get everything connected, and we can just switch out the CSS in the <style> tag and the JSX in the MyCustomComponent function to suit the needs for the grid!
The JSX can be taken largely from the stackoverflow example you linked, just with a couple modifications for Retool.
React lets you dynamically define HTML components to be part of the element you're creating by passing JSX expressions within {}. Here, there's a div that represents the grid, and then all the nodes within it are generated dynamically within {}:
<div id="grid" />
  {/* map function that returns more divs /*}
</div>
That's done by mapping over the nested arrays in the dataset, which we'll pass to the model of the custom component so something like:
model.gridData.map((row, y) => (
   <div>
      {/* a nested map function for each node */}
   </div>
)
The nodes themselves is where you can add the click handler by passing a function to the onClick property of the element you create. In this case we can use the modelUpdate function which lets us pass data back to the app model which we can reference in the rest of the Retool app. So the onClick handler will look something like this:
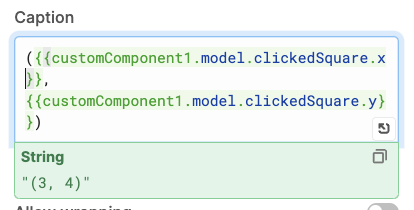
() => modelUpdate({ clickedSquare: { x, y }})
Note we're passing a clickedSquare property back that has the clicked coordinates. This can be referenced elsewhere in the Retool app using {{ customComponent.model.clickedSquare }}
We can also pass it a type property to reference with CSS so that it can be colored correctly, since we're mapping over the data being passed in that might be something like
type={node[0]}
All together it looks like this:
const MyCustomComponent = ({ model, modelUpdate }) => (
    <div id="grid">
      {model.gridData.map((row, y) => (
        <div key={y} className="row">
          {row.map((node, x) => (
            <div
              key={x}
              className="map_square"
              type={node[0]}
              onClick={() =>
                modelUpdate({
                  clickedSquare: { x, y }
                })
              }
            />
          ))}
        </div>
      ))}
    </div>
  );
We can then add in the CSS that colors each square based on its type:
  #grid{
    display: flex;
    flex-direction: column;
  }

  .row{
    display: flex;
  }

  .map_square{
    height: min(18vh, 18vw);
    width: min(18vh, 18vw);
  }

  .map_square[type="0"]{
    background-color: green;
  }

  .map_square[type="1"]{
    background-color: blue;
  }
Again, this is only the start. It's possible to conditionally create img elements instead of div and pass in source urls from the component data, and much more!
Let me know if that's helpful or if you have any questions!
This looks pretty spiffy. I'll be diving into this example either today or starting next week.
Thanks!
Ok so I put my default map data in your model and that works pretty great.
Next i added a second array to the model.
{
gridData: {{exampleData.data}},
placedItems: {{getXYItem.data}}
}
Then I added a line for how i assumed this would work (I am wrong and need help on this)
{row.map((node, x) => (
<div
key={x}
className="map_square"
type={node[0]}
contenttype={model.placedItems[y][x].contenttype}
onClick={() =>
modelUpdate({
clickedSquare: { x, y }
})
}
/>
))}
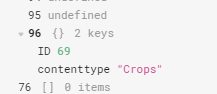
For reference this is what placed items is.
{getitems.map( items => (
  content[items.y][items.x] = {"ID": items.objectID, "contenttype": items.contenttype}
))};
This returns an object that looks correct on inspection. Most values in this 100x100 array are empty, but there are some populated with the data i expect.
So how do i add that property to the div? Also, i would want to add the contenttype property to the onclick function too so i can access it in the node query you created in your example.
What are you seeing returned by the custom component when you add that code?
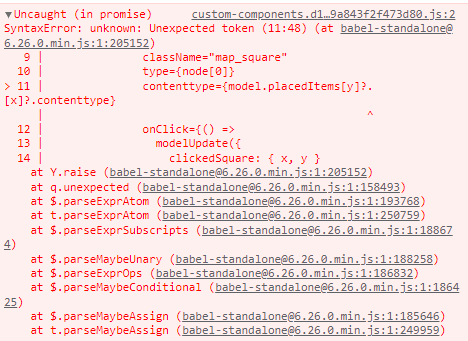
My first guess is to say that, since model.placedItems[y][x] might not always be defined you're likely to run into any error when you try and access the contenttype property on it. If that's the case I'd expect there'd be something like the following error in your debug tools:
![]()
And you might be able to fix it using optional chaining:
contenttype={model.placedItems[y]?.[x]?.contenttype}
It could be a separate issue though... ![]()
So in the editor I don't see any error on the console. But in the browser based console i see this error. What is displayed is just an empty shell of a component.
BTW optional chaining is clearing other errors with nulls elsewhere in my apps, so Thanks very much for showing me that.
I also tried declaring explicitly those properties as "" instead of null in the array of objects. Still no dice.
Ok so after the retool community office hours we arrived at a solution.
<script>
  function getContentType(model, x ,y ){
    return model.placedItems?.[y]?.[x]?.contenttype;
  }
</script>
Place this above the babel script. This allows the chaining function mentioned above.
then I can just refer to the function
contenttype={getContentType(model, x, y)}
This got me where i needed to go. Thanks so much @Kabirdas
1 Like