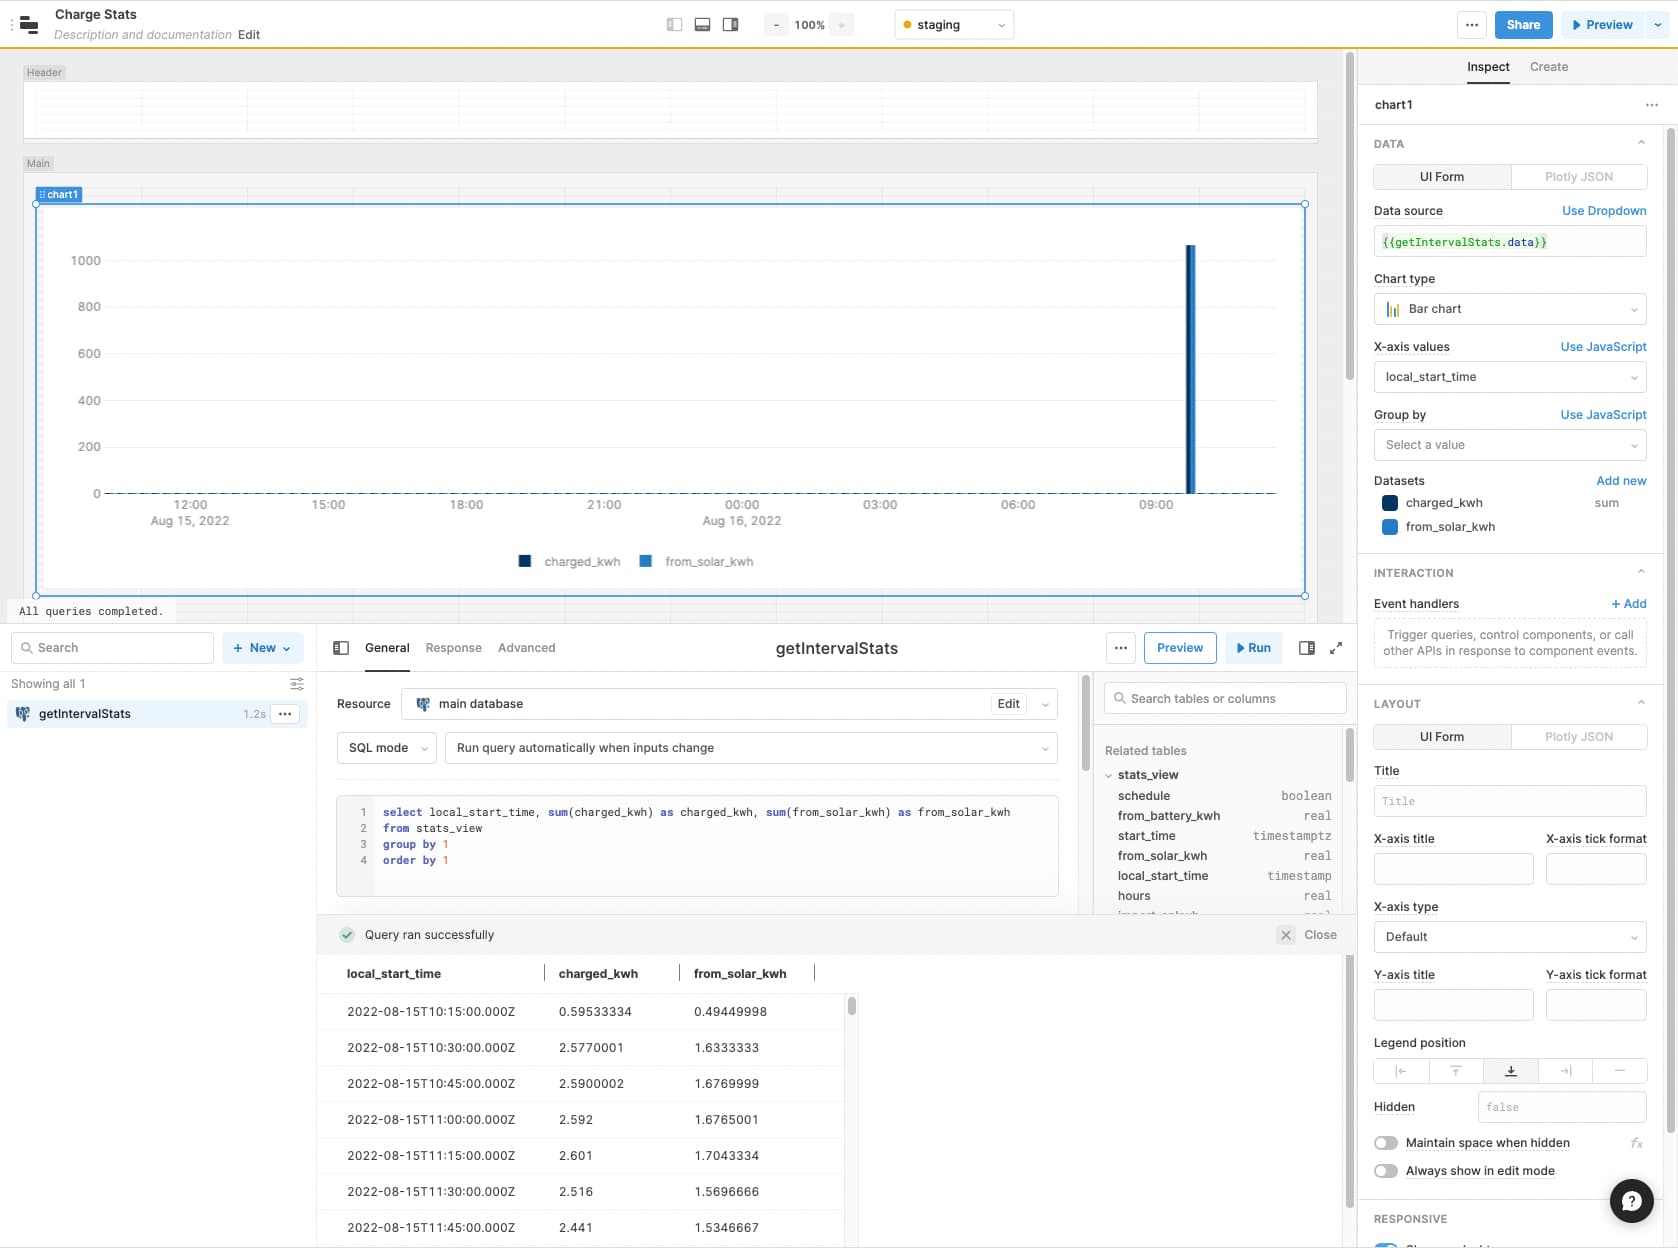
I'm trying to make a simple chart based on a timeseries query from Postgres. The X axis values are of type TIMESTAMP, and the Y values are numbers.
The query looks fine, and the chart X axis looks good, but the chart data is totally wrong: instead of a value for each X axis value, there is a single large value towards the end of the X axis. Refer to the image.
Is this a bug?
Cheers.