Hi,
I have a rest api query which is returning some results like this:
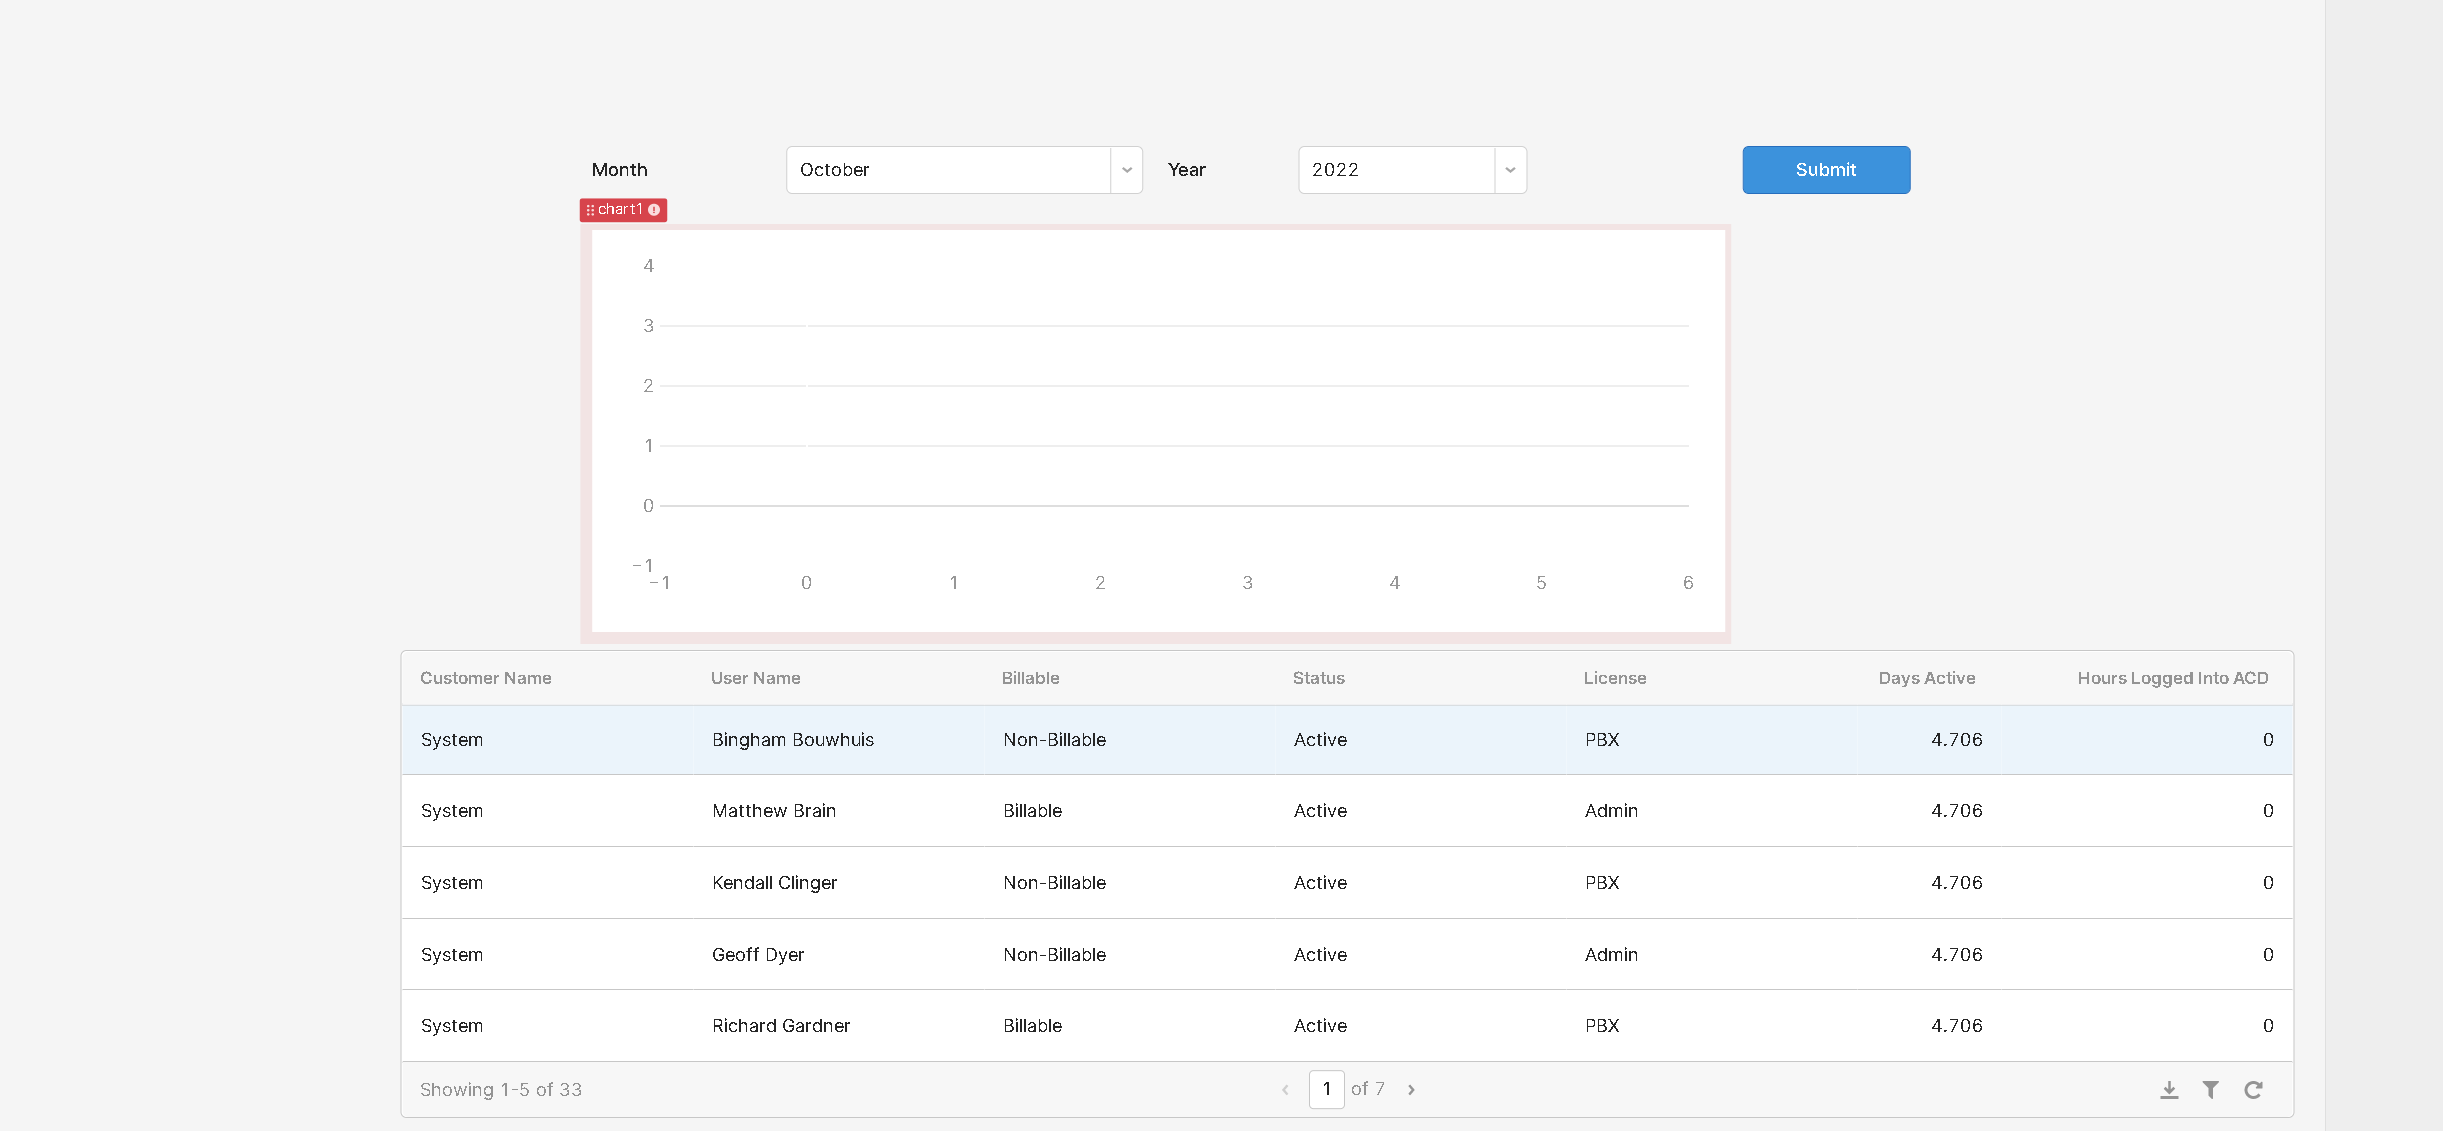
I'm trying to graph the "license" column which could be either "acd" or "pbx" as a count.
ie customer x has 4 acd and 2 pbx.
Any guidance?
Hi,
I have a rest api query which is returning some results like this:
I'm trying to graph the "license" column which could be either "acd" or "pbx" as a count.
ie customer x has 4 acd and 2 pbx.
Any guidance?
Any suggestions? I would have thought counting text in an api query and ploting the result is easy, what am I missing?
Hi roggy! How do you currently have your Chart component configured?
Hey Jay!
Thanks for taking a look...
[
  {
    "name": "License",
    "x": {{formatDataAsObject(query2.data.Result).Customer Name}},
    "y": {{formatDataAsObject(query2.data.Result)['License']}},
    "type": "bar",
    "hovertemplate": "<b>%{x}</b><br>%{fullData.name}: %{y}<extra></extra>",
    "transforms": [
      {
        "type": "groupby",
        "groups": {{formatDataAsObject(query2.data.Result)['Customer Name']}},
        "styles": [
          {
            "target": {{_.uniq(formatDataAsObject(query2.data.Result)['Customer Name'])[0]}},
            "value": {
              "marker": {
                "color": "#033663"
              }
            }
          },
          {
            "target": {{_.uniq(formatDataAsObject(query2.data.Result)['Customer Name'])[1]}},
            "value": {
              "marker": {
                "color": "#247BC7"
              }
            }
          },
          {
            "target": {{_.uniq(formatDataAsObject(query2.data.Result)['Customer Name'])[2]}},
            "value": {
              "marker": {
                "color": "#55A1E3"
              }
            }
          },
          {
            "target": {{_.uniq(formatDataAsObject(query2.data.Result)['Customer Name'])[3]}},
            "value": {
              "marker": {
                "color": "#DAECFC"
              }
            }
          },
          {
            "target": {{_.uniq(formatDataAsObject(query2.data.Result)['Customer Name'])[4]}},
            "value": {
              "marker": {
                "color": "#EECA86"
              }
            }
          },
          {
            "target": {{_.uniq(formatDataAsObject(query2.data.Result)['Customer Name'])[5]}},
            "value": {
              "marker": {
                "color": "#E9AB11"
              }
            }
          },
          {
            "target": {{_.uniq(formatDataAsObject(query2.data.Result)['Customer Name'])[6]}},
            "value": {
              "marker": {
                "color": "#D47E2F"
              }
            }
          },
          {
            "target": {{_.uniq(formatDataAsObject(query2.data.Result)['Customer Name'])[7]}},
            "value": {
              "marker": {
                "color": "#C15627"
              }
            }
          },
          {
            "target": {{_.uniq(formatDataAsObject(query2.data.Result)['Customer Name'])[8]}},
            "value": {
              "marker": {
                "color": "#224930"
              }
            }
          }
        ]
      },
      {
        "type": "sort",
        "target": {{formatDataAsObject(query2.data.Result).Customer Name}},
        "order": "ascending"
      },
      {
        "type": "aggregate",
        "groups": {{formatDataAsObject(query2.data.Result).Customer Name}},
        "aggregations": [
          {
            "target": "y",
            "func": "count",
            "enabled": true
          }
        ]
      }
    ]
  }
]
Hi Jay - is the above what you are after?
Or is there someone else that can help?
Hey @roggy!
It looks like there are 3 places (lines 4, 89, and 94) where you're referencing
{{formatDataAsObject(query2.data.Result).Customer Name}}
instead of
{{formatDataAsObject(query2.data.Result)['Customer Name']}}
can you try switching those out and let us know if that works?
Hey Kabirdas!
Thank you for looking - I made that change and it looked to sort out my issue with the 'x' axis but it is not counting the y axis - which should count the words PBX,ACD and Admin.
[
  {
    "name": "License",
    "x": {{formatDataAsObject(query2.data.Result)['Customer Name']}},
    "y": {{formatDataAsObject(query2.data.Result)['License']}},
    "type": "bar",
    "hovertemplate": "<b>%{x}</b><br>%{fullData.name}: %{y}<extra></extra>",
    "transforms": [
      {
        "type": "sort",
        "target": {{formatDataAsObject(query2.data.Result)['Customer Name']}},
        "order": "ascending"
      },
      {
        "type": "aggregate",
        "groups": {{formatDataAsObject(query2.data.Result)['Customer Name']}},
        "aggregations": [
          {
            "target": "y",
            "func": "sum",
            "enabled": true
          }
        ]
      }
    ],
    "marker": {
      "color": "#033663"
    }
  }
]
what should I try next?
Would you mind also posting a sample of what query2.data.Result looks like so we can test against its structure?
