Dear Support Team,
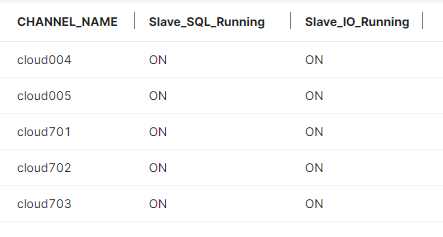
i want to create a Chart Bar with values for the y-Axis (ON/OFF). ON should be displayed in the positiv y-axis direction (color green) and OFF into the negtive y-axis direction (color red).
I don´t know how i can display this values (ON/OFF). With numeric values it is all ok, but i need ON/OFF.
Is this possible and can you please help me?
thanks and regards
Gerhard