Hi!
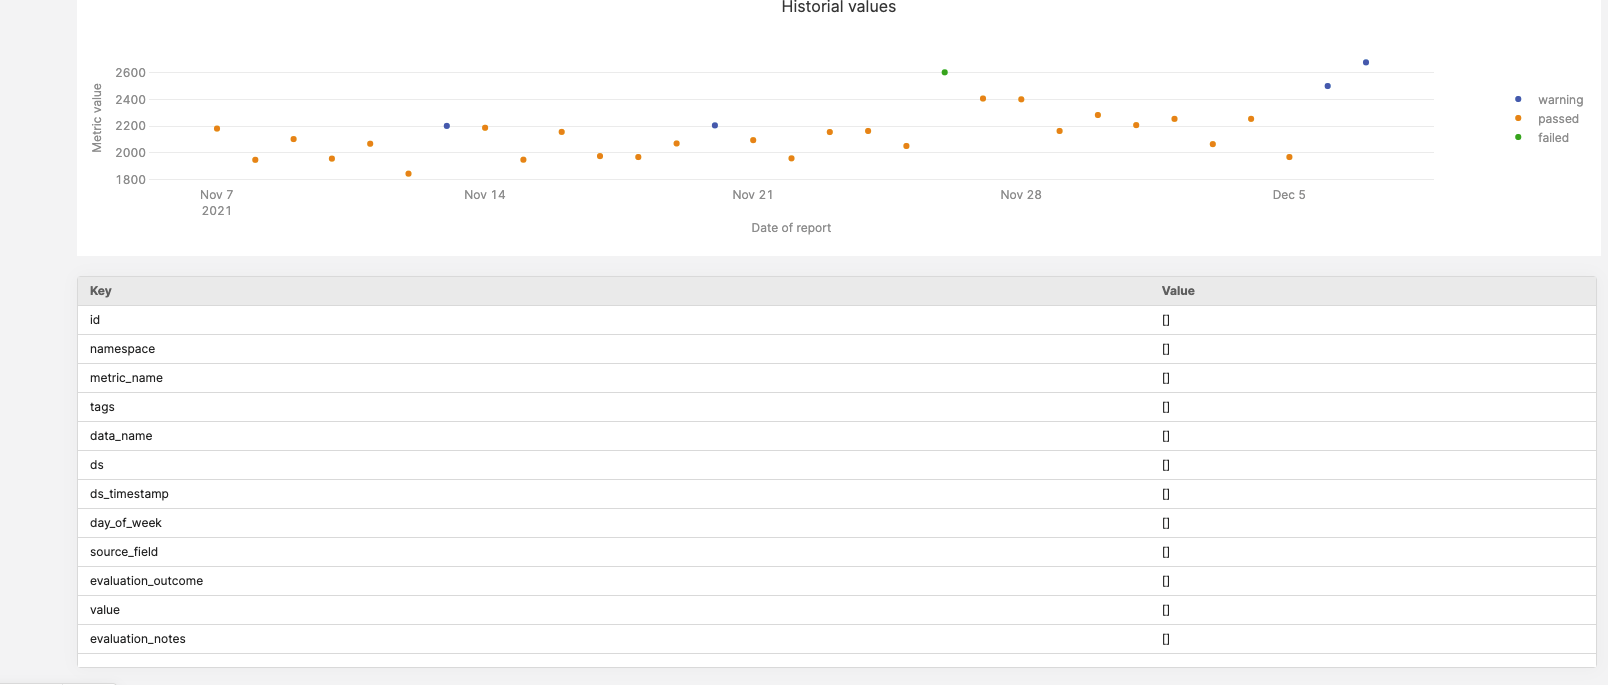
I'm trying to create an interactive query that changes when a users clicks an specific data point in a chart. This chart x-axis is datetime and y-axis is the value a reported value for that specific datetime.
I want the query to filter by the unique_id of that specific data point. Any clue how I can access the id when clicking the graph?
@Tomp1998
Hey there! Would you mind sending screenshots of what you have so far? I want to make sure I am understanding what you are asking 
I have this chart with data points over time. I want to click on an specific point and have the keyValue full field with the data of that point.
But the problem is that, since the chart doesn't need the id value to create the plot then, I cannot access that value
@Tomp1998
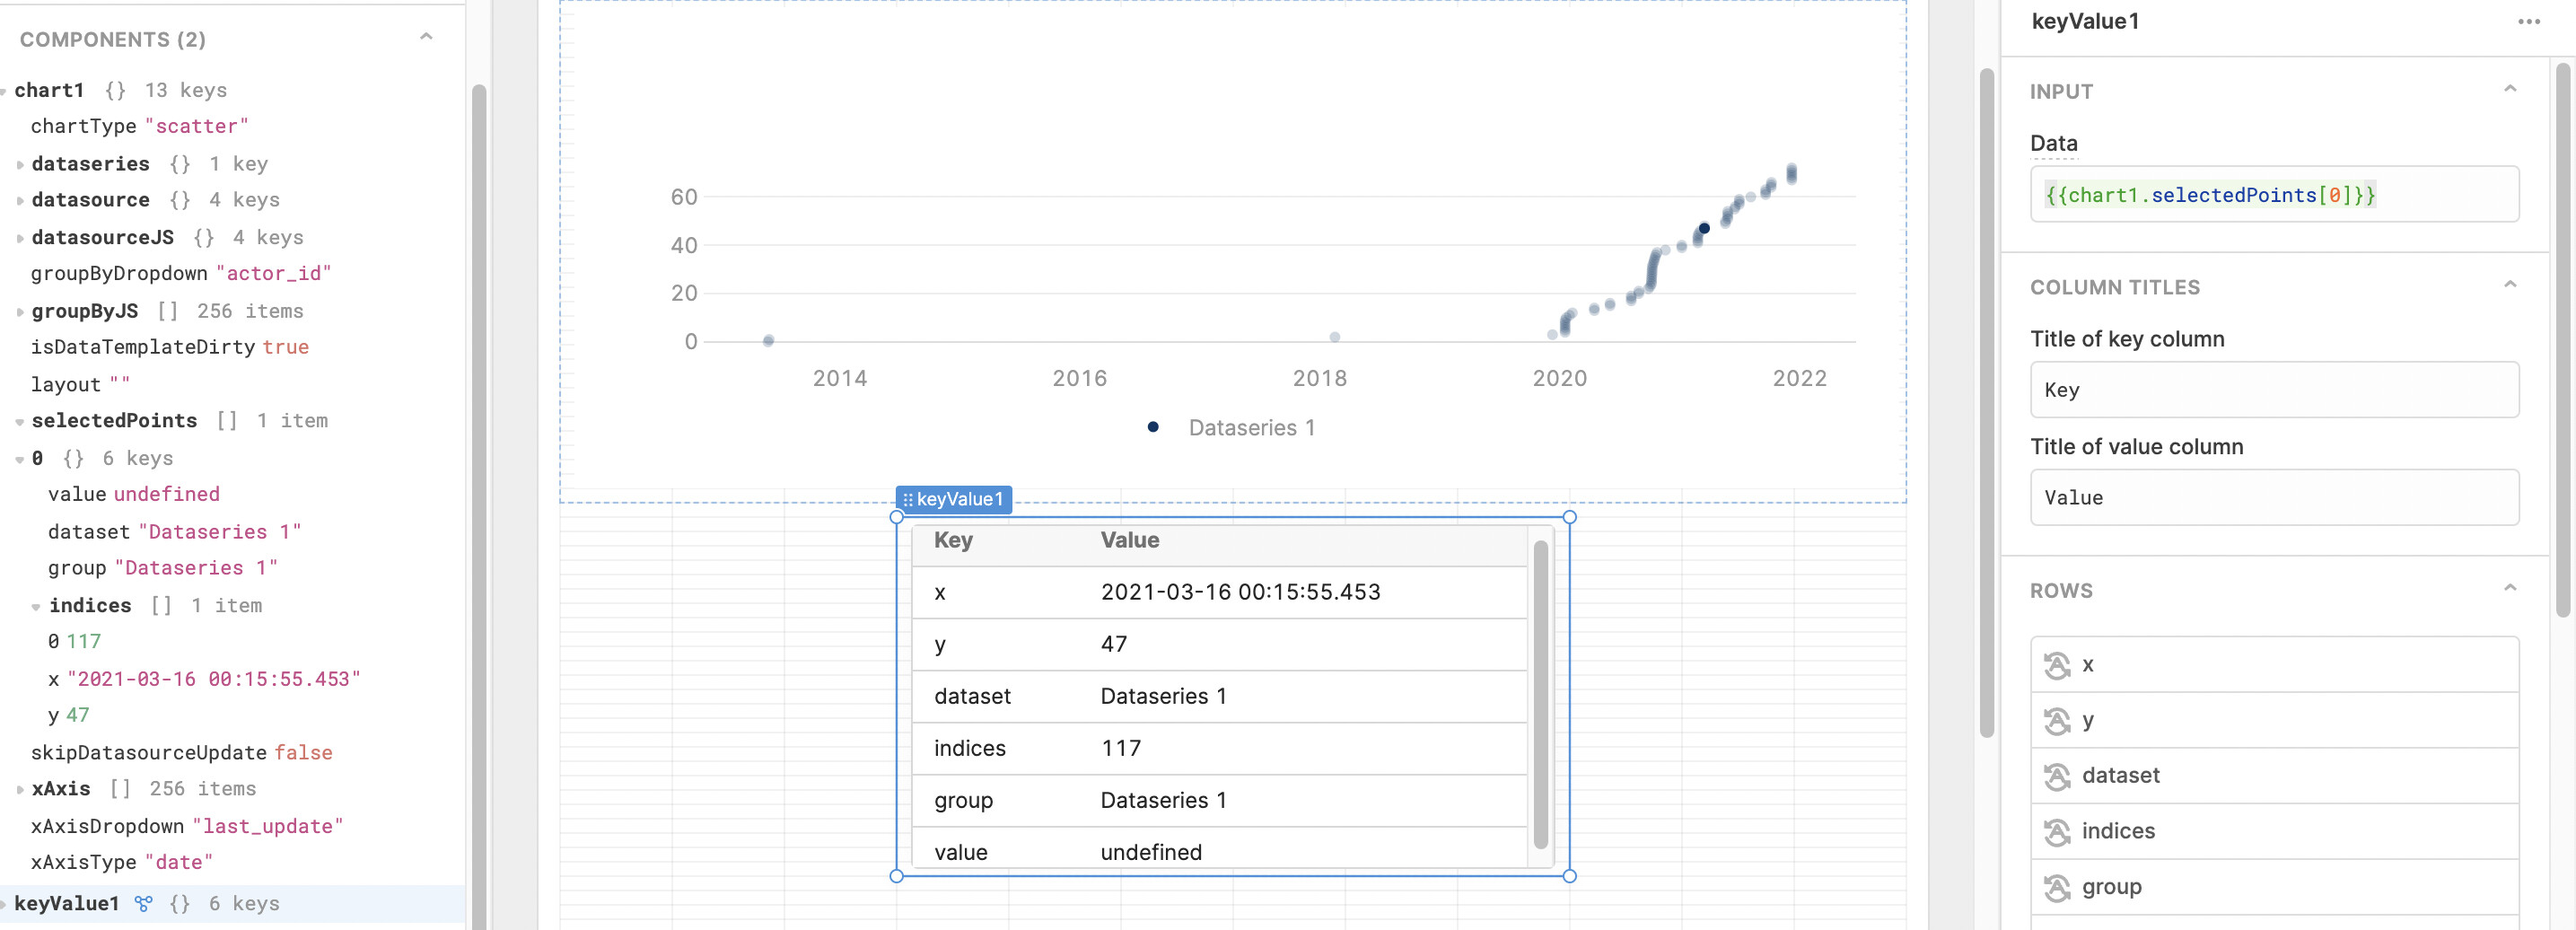
Thanks for the screenshot! You can access the clicked data in the 'selectedPoints' property. Is the ID defined in the selectedPoints property?
It's not. Is there a way to add the ID to those properties?
@Tomp1998
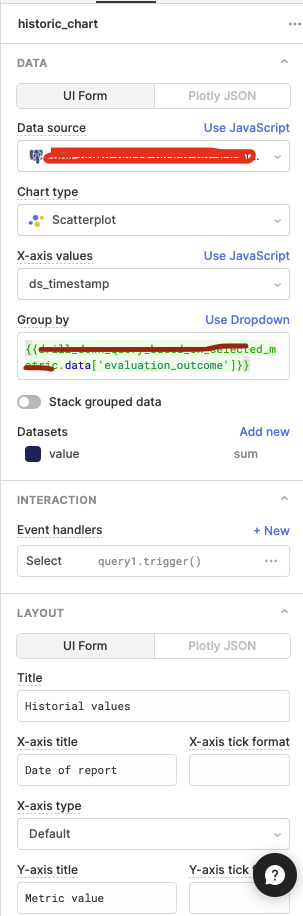
Would you mind sharing a screenshot of how your chart is set up? Are you using Group by?
Also, we use this library and you may be able to find additional resources there
Sure. Look, I'm grouping by evaluation_outcome
@Tomp1998
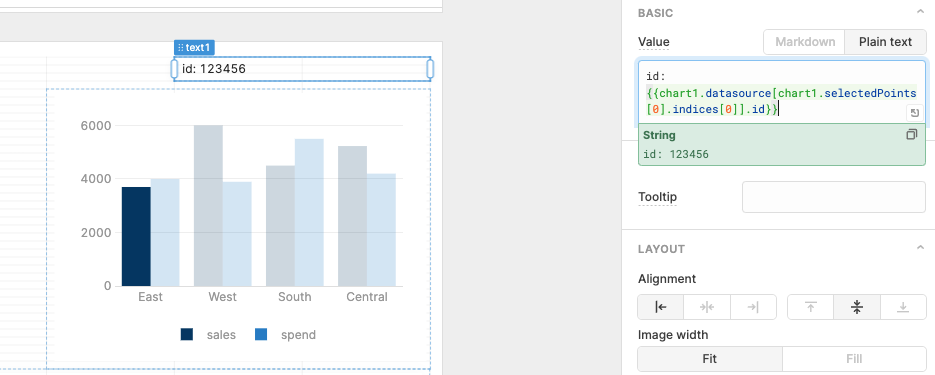
Thanks for the visual! A thought we had was that if you add the ID to the Data Source:
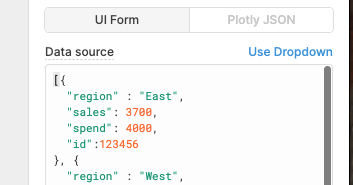
You would be able to grab that as shown below: